
What changed, in one sentence
Over the last few weeks I have observed an increase in referral traffic coming from ChatGPT to websites: users who run a prompt, see a response, and then click a link that takes them to a brand’s site. Once normalised by the number of active sites, the lift converges on roughly 60% per site across three independent measurement sources.
This article lays out exactly what I measured, how I measured it, where the sources agree and disagree, and what I think it means for brands. I have kept the distinction between what the data shows and what I am inferring explicit throughout.
The headline numbers
The first thing to be clear about is that I am reporting a per-site daily traffic metric, not a raw total. The raw totals were distorted by changes in the customer base during the period (more on that below), so the per-site figure is the cleaner signal.
Per-site daily traffic change, April vs May 2026
| Source | Per-site daily traffic change |
|---|---|
| Adobe Analytics | +60% |
| GA4 | +97% |
| Optel | +61% |
Comparison period: April vs May 2026. Metric: per-site daily pageviews, normalised by active sites. Source: internal Adobe analysis, June 2026 deck, slide 2.
The two figures I would anchor on are the Adobe Analytics and Optel numbers, which sit at +60% and +61%. GA4 is higher at +97%. I treat the aggregate, weighted across sources, as approximately a 60% improvement per site. That is the number I am most comfortable defending.
Why I report per-site and not raw totals
This is the part that matters most for anyone trying to reproduce or sanity-check the result, so I want to be precise about it.
During April to May 2026, the customer base behind each source changed. More customers were onboarded into some sources, and the active site count dropped in another. That movement inflated the raw totals for Adobe Analytics and GA4, and deflated them for Optel. If you look at raw total pageview change alone, you get a misleading picture. Normalising by active site count removes that distortion.
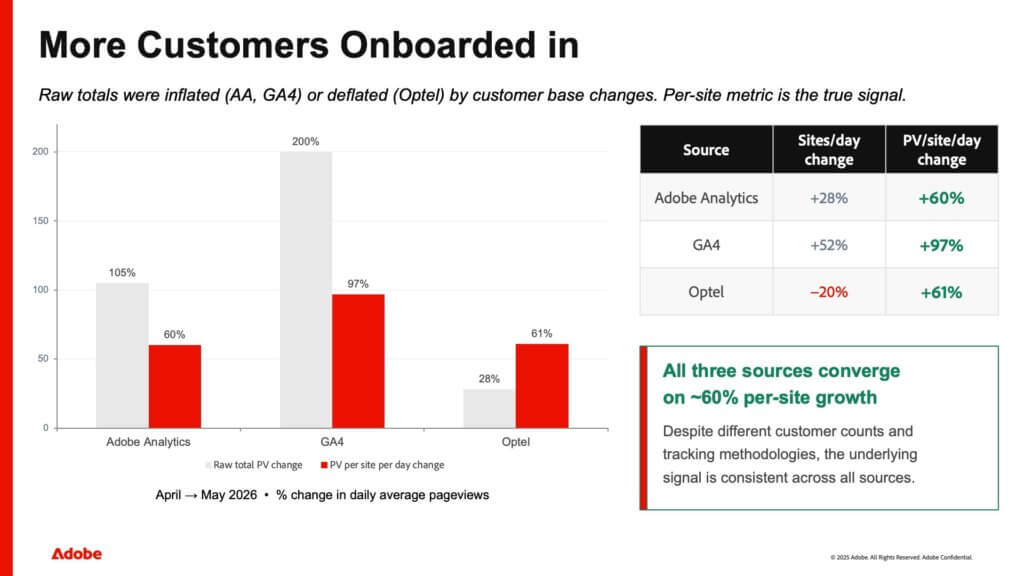
Raw total vs per-site change, by source
| Source | Sites/day change | Raw total PV change | PV per site per day change |
|---|---|---|---|
| Adobe Analytics | +28% | +105% | +60% |
| GA4 | +52% | +200% | +97% |
| Optel | −20% | +28% | +61% |
Comparison period: April to May 2026. Metric: percentage change in daily average pageviews. Source: internal Adobe analysis, June 2026 deck, slide 4.
How to read this table
Take Optel as the clearest example. Its raw total pageviews rose only +28%, which looks modest. But its active site count fell by 20% over the same window. Once you divide pageviews by the number of sites actually reporting, the per-site figure is +61%. The raw number understated the real per-site lift because there were fewer sites generating it.
The opposite happened with GA4 and Adobe Analytics: their site counts grew (+52% and +28% respectively), so part of the raw total increase (+200% and +105%) was simply more sites being measured, not more traffic per site. Stripping that out leaves +97% and +60% per site.
The finding
Despite three different customer counts and three different tracking methodologies, the per-site signal converges. Adobe Analytics and Optel land within one percentage point of each other (+60% and +61%), and the aggregate sits around 60%. I consider convergence across independent tools to be the strongest evidence here, because it is unlikely that three separate measurement systems would produce the same artefact for unrelated reasons.
Caveat I want to flag: GA4’s +97% is meaningfully higher than the other two. The deck presents the convergence as “~60% per-site growth,” and I stand by that as the conservative read, but I am not able, from the data provided, to fully explain why GA4 runs higher. It may relate to how GA4 attributes referral sessions versus the other two systems. I am noting this as an open item rather than resolving it.
The uplift was a step-change, not gradual growth
The shape of the increase matters as much as its size. This was not a slow climb. It was a step-change that happened within a single week.
I looked at weekly OpenAI referral pageviews from Optel for January through May 2026. I used Optel for this view specifically because it gave me the largest sample and the longest history.
Weekly OpenAI referral pageviews from Optel (illustrative, indexed)
The chart in the deck plots weekly values on a relative scale from roughly 1.1 to 3.0. The table below reproduces the approximate weekly pattern read from that chart. These are indexed/relative values as shown in the source visualisation, not absolute counts.
| Week commencing | Approx. relative value | Phase |
|---|---|---|
| Jan 5 | 1.7 | Baseline |
| Jan 12 | 1.8 | Baseline |
| Jan 19 | 1.9 | Baseline |
| Jan 26 | 1.9 | Baseline |
| Feb 2 | 1.85 | Baseline |
| Feb 9 | 1.8 | Baseline |
| Feb 16 | 1.75 | Baseline |
| Feb 23 | 1.85 | Baseline |
| Mar 2 | 1.75 | Baseline |
| Mar 9 | 2.0 | Baseline |
| Mar 16 | 2.05 | Baseline |
| Mar 23 | 2.25 | Baseline |
| Mar 30 | 2.1 | Baseline |
| Apr 6 | 2.25 | Baseline |
| Apr 13 | 2.25 | Baseline |
| Apr 20 | 1.75 | Dip (unexplained) |
| Apr 27 | 1.1 | Dip (unexplained) |
| May 4 | 2.0 | Transition |
| May 11 | 2.9 | Step-change |
| May 18 | 3.0 | Step-change |
Source: internal Adobe analysis, June 2026 deck, slide 3. Values are approximate, read from the source chart, and indexed rather than absolute.
What the chart shows
Three things stand out, and they match the key insights called out in the deck:
- A stable baseline from January through April. In absolute terms the deck describes this baseline as roughly 1.7M to 2.3M referral pageviews per week. The click-through rate from responses, and the referral amount, stayed more or less flat across this window.
- An unexplained dip in late April. The weeks of April 20 and April 27 show a decrease. I do not have an explanation for this in the data. My honest read, stated as opinion and not fact, is that this looks like experimentation on OpenAI’s side during that window. I cannot confirm that.
- A step-change in May. Pageviews jumped to roughly 3 times the average April week by the week commencing May 11. This was a step-change, not gradual growth.
A dating discrepancy I need to flag
There is an inconsistency in my own source materials about exactly when the step-change began, and I would rather surface it than paper over it:
| Source | Date attributed to the change |
|---|---|
| Deck, slide 3 (key insight) | “May 4+” step-change |
| Video walkthrough | Increase clearly visible “after May eleventh” |
| Deck, slide 7 (URL Inspector tooltip) | “May 7, 2026” |
These three references point to the same event but cite slightly different start dates within early-to-mid May. The weekly granularity of the data is part of the reason: a weekly bar for the week commencing May 4 can capture a change that began mid-week. I am confident the step-change occurred in early-to-mid May 2026 and sustained through late May. I am not able to pin it to a single day from the data I have, and I would not claim a precise date.
Why the traffic increased: brand mentions became clickable links
The natural question is whether users simply started clicking citations more often at random. Based on what I observed, that is not what happened. The mechanism is a product behaviour change in ChatGPT.
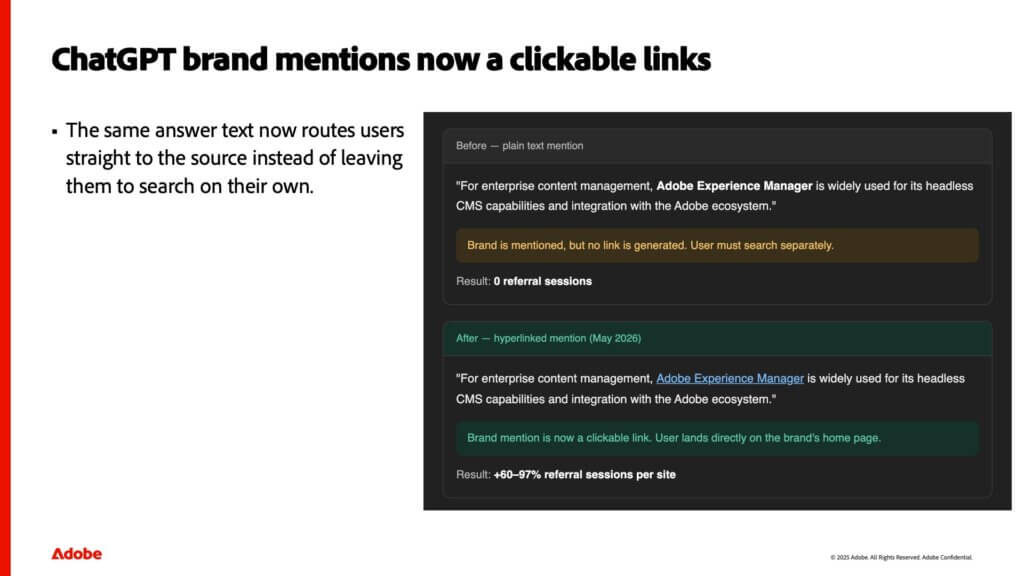
Previously, when your brand was cited in a ChatGPT response, you would get your brand name in bold but with no link. The user had to go and search for you separately. Now, ChatGPT is adding a hyperlink to the brand mention itself, pointing to the brand’s official website.
Before vs after
| Before (plain text mention) | After (hyperlinked mention, May 2026) | |
|---|---|---|
| Answer text | Brand name appears, bolded | Same answer text, brand name now linked |
| Link behaviour | No link generated; user must search separately | Brand mention is a clickable link to the brand’s home page |
| Referral result | 0 referral sessions | +60% to +97% referral sessions per site |
Source: internal Adobe analysis, June 2026 deck, slide 5. Example brand used in the deck illustration: a brand mentioned in an enterprise content management answer.
The way I describe it: this is the same dynamic as the blue links in a Google search results page. When the mention is clickable, the user is far more likely to click through. The change is not limited to formal citations; it now extends to the brand mention in the body of the answer. That is the structural reason the per-site referral numbers moved.
What this means for brands
Here are my conclusions. I have separated each into the finding, the evidence behind it, and the implication, so you can weigh them independently.
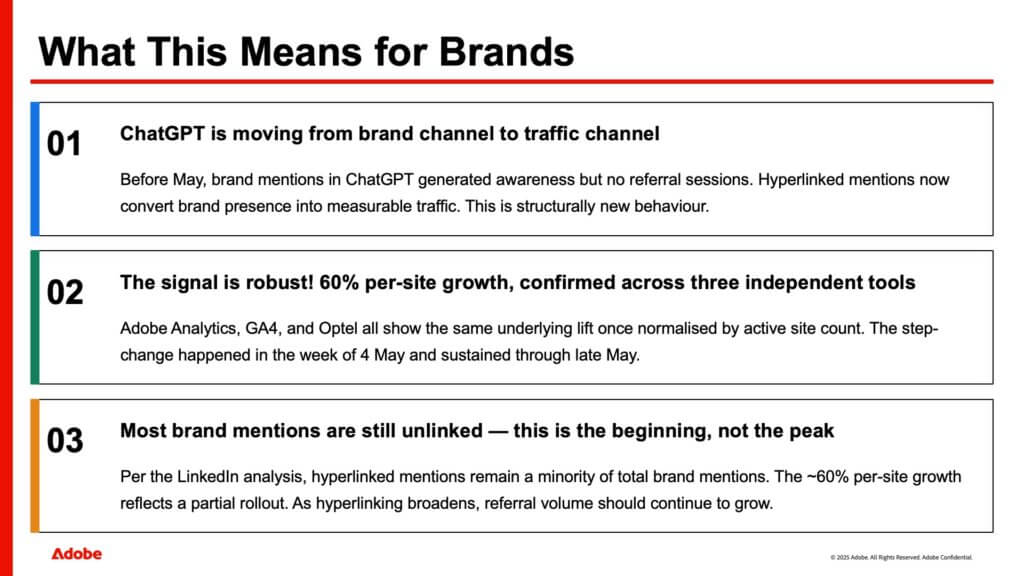
Finding 1: ChatGPT is shifting from a brand channel to a traffic channel
- Evidence: Before May 2026, brand mentions in ChatGPT generated awareness but produced 0 referral sessions (deck, slide 5). Hyperlinked mentions now convert that brand presence into measurable referral traffic, observed across three sources (deck, slides 2 and 4).
- Implication: Presence in ChatGPT answers is no longer only a visibility play. It can now be tracked and reported as a referral acquisition channel. This is structurally new behaviour, not a continuation of the prior pattern.
Finding 2: The signal is robust and confirmed across three independent tools
- Evidence: Adobe Analytics, GA4, and Optel all show the same underlying per-site lift once normalised by active site count, converging around 60% (deck, slide 4). The step-change occurred in the week of early-to-mid May and sustained through late May (deck, slide 3). The sample spans thousands of websites.
- Implication: This is not a quirk of one dataset or one customer. The convergence across independent methodologies, on a large site sample, is what gives me confidence in reporting it.
- Caveat: GA4’s per-site figure (+97%) sits above the other two (+60% and +61%). I report ~60% as the conservative aggregate and flag the GA4 gap as unexplained from the available data.
Finding 3: Most brand mentions are still unlinked, so this is the beginning, not the peak
- Evidence: Hyperlinked mentions currently remain a minority of total brand mentions, per the broader analysis referenced in the deck. The ~60% per-site growth therefore reflects a partial rollout (deck, slide 6).
- Implication: If hyperlinking continues to broaden across more mentions, referral volume should continue to grow, potentially beyond 60%. I want to be careful here: this is a forward-looking inference based on the direction of the rollout, not a measured result. I am stating it as an expectation, not a fact.
Tracking this in Adobe LLM Optimizer
Because of these traffic increases, we added a feature to Adobe LLM Optimizer inside the URL Inspector. It surfaces Referral Hits from LLMs, drawn from Optel and CDN logs, so that when an event like this release happens on a given date, you can see right away what it was and why it affected your site.
In the product, the May event is annotated directly on the timeline with the note that ChatGPT referral traffic to brand websites increased approximately 60% because ChatGPT started automatically linking brand names in its responses to the brands’ official websites. The goal of the feature is to connect a movement in your referral traffic to the underlying cause without you having to reconstruct it manually.
Disclosure repeated for clarity: this is an Adobe product I work on.
Practical steps you can take
Following the spirit of ending on something actionable, here is what I would check if I were responsible for a brand’s LLM visibility right now:
- Segment your referral traffic by LLM source. If you have not already isolated ChatGPT and other LLM referrers in your analytics, do that first. You cannot manage what you are not measuring separately.
- Compare April against May 2026 on a per-site or per-property basis. Look at the per-site or per-property figure, not the raw total, especially if your tracked-property count changed during the period. The Optel example above shows how a raw total can hide the real per-site movement.
- Check whether your brand mentions in ChatGPT are linked. Run representative prompts for your category and observe whether your brand name appears as a clickable link or as plain bolded text. Linked mentions are still a minority, so there is likely headroom.
- Annotate the early-to-mid May 2026 step-change in your own reporting. If you see a jump in LLM referral traffic in that window, this rollout is the most probable explanation based on the data here.
- Re-check periodically. Because hyperlinking appears to be a partial, ongoing rollout, the picture is likely to keep changing. Treat this as a moving baseline rather than a settled number.
What I am not claiming
In keeping with separating fact from opinion:
- I am not claiming a precise start date for the change. The data supports early-to-mid May 2026, and my own sources disagree on the exact day.
- I am not claiming the GA4 +97% figure is the right headline. I report ~60% as the conservative aggregate and treat the GA4 gap as unexplained.
- I am not claiming referral volume will definitely exceed 60% in future. That is a forward-looking expectation based on the rollout being partial, not a measurement.
- I am not disclosing customer identities, and the figures are normalised and aggregated rather than tied to any single named site.
Summary
Across Adobe Analytics, GA4, and Optel, I observed an increase in ChatGPT referral traffic in May 2026 that converges on roughly 60% per site once normalised by active site count. The increase was a step-change in early-to-mid May, not gradual growth, and the mechanism behind it is ChatGPT turning brand mentions into clickable hyperlinks rather than plain text. Because most brand mentions are still unlinked, I expect this channel to keep developing. I have flagged the open questions, the dating discrepancy, and the limits of what the data supports so that anyone can challenge or reproduce the analysis.
Methodology: comparison of per-site daily pageviews, April vs May 2026, normalised by active site count, across three measurement sources (Adobe Analytics, GA4, Optel). Weekly trend view drawn from Optel, January to May 2026, chosen for the largest sample and longest history. Sample spans thousands of websites. Figures are aggregated and normalised; no individual customers are identified. Source materials: internal Adobe analysis deck “ChatGPT referral traffic increase” (June 2026) and accompanying video walkthrough.
If you spot an error in this analysis, please get in touch via longato.ch and I will investigate and publish a visible correction once verified.
Disclosure. I work at Adobe on the LLM Optimizer team. The data, screenshots, and product references in this article come from my work there. All views expressed are my own and do not represent those of my employer. This article is based on an internal analysis I presented in June 2026 (deck: ChatGPT referral traffic increase, Adobe LLM Optimizer) and the accompanying walkthrough video. Where I infer beyond the data, I say so. Customer names are not disclosed.
Leave a Reply